Chapter 5: Extraction of the Critical Exponent
of the Magnetization5.1 Introduction
Suppose A(ε) is a function describing the behavior of a quantity, such as magnetization, in terms of ε = 1 – T/Tc, where T is temperature and Tc is the critical temperature. Then the limit λ as ε → 0 of ln[A(ε)]/ln(ε), if it exists, is called the critical exponent associated with A. In this case we write A ~ ελ ("~" is read as "is asymptotically equal to").
Among the critical exponents for magnetic systems are those for specific heat, α, magnetization, β, isothermal susceptibility, γ, and correlation length, ν. These are not all independent, and it is possible to derive inequalities such as α + 2β + γ ≥ 2 (see, e.g., Yeomans, 1992, p.30).
From the above definition of a critical exponent we have that in the ideal case the magnetization M just below the critical temperature Tc varies as (1 – T/Tc)β. This does not imply that M(T) = a.(1 – T/Tc)β, for some constant a. Rather (according to Stanley 1971, pp.39-40, and Yeomans 1992, p.26) we have
M(T) = a.(1 – T/Tc)β.[1 + a'.(1 – T/Tc)β' + ...]
for some
constants a, β, a', β', ...However, near the critical point the leading term is dominant, in which case M(T) is approximated by the expression a.(1 – T/Tc)β. This approximation will now be used to obtain (approximate) estimates of β for several kinds of lattices.
Consider two temperature values, T1 and T2, just below Tc, with T1 < T2, then
M1 = M(T1) = a.(1 – T1/Tc)β and M2 = M(T2) = a.(1 – T2/Tc)β,
so M1/M2 = (1 – T1/Tc)β / (1 – T2/Tc)β = [(1 – T1/Tc) / (1 – T2/Tc)]β
so β = ln(M1/M2) / ln[(1 – T1/Tc) / (1 – T2/Tc)]
Take T1 = 0.98Tc and T2 = 0.99Tc, then
[ (1 – T1/Tc) / (1 – T2/Tc) ] = 0.02 / 0.01 = 2
so β = ln(M1/M2) / ln(2), so
1/β = ln(2) / ln(M1/M2) (1)
Thus all we have to do is to measure M1 and M2 (via Monte Carlo simulations) to obtain an approximate value for β.
In the remainder of this chapter we shall extract β for the Ising model on the square, triangular and honeycomb lattices, and then we shall consider the 3-state Potts model.
5.2 The Ising Model on the Square Lattice
The simulation program was used to extract the value of β for the pure square Ising model using the method described above to obtain values for M1 and M2.
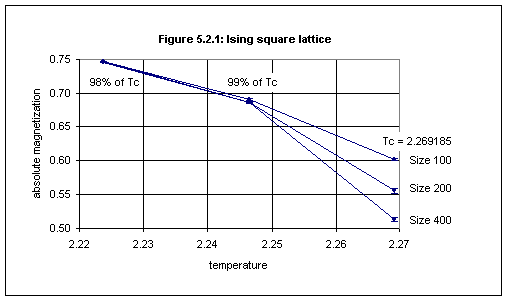
For lattices of size 100, 200 and 400, values of the absolute magnetization were obtained for temperatures 2.223801 and 2.246493 (resp. 98% and 99% of the critical temperature of 2.269185), using 1000 samples for lattice sizes 200 and 400 and 4000 samples for lattice size 100, with simulations over timepoints 0 through 50, averaging over timepoints 31 through 50. Wolff dynamics was used (which produces a stable value for the absolute magnetization after 20 timesteps). The results are shown in Figure 5.2.1 (based on Table 5.2.1 in Appendix 5).
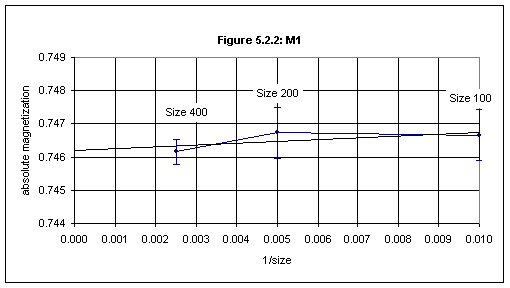
To obtain the "ideal" values of of M1 and M2, i.e., the values for the infinite lattice, we plot the values obtained by measuring these quantities in the three finite lattices against the reciprocal of the lattice size, and then perform a linear fit to the data, as shown in Figure 5.2.2 for M1, which is based on the data in Table 5.2.2 (below). The intersection of the straight line with the vertical axis gives the ideal ("infinite") value.
Table 5.2.2
Size
100
200
400
Reciprocal of size
0.0100
0.0050
0.0025
M1
Abs. mag.
0.7467
0.7467
0.7462
Std. dev.
0.0008
0.0008
0.0004
M2
Abs. mag.
0.6909
0.6869
0.6861
Std. dev.
0.0012
0.0014
0.0007
The linear fit shown in Figure 5.2.2 was done in Excel. A "least squares" method of obtaining a linear fit, y = a + bx, to data with error bars (and also without), which has the advantage of providing an error estimate for the intersection a with the vertical axis, is given in Press et al., 1992 (pp.657-666). The present writer has written a program which implements this method, and this program is described in Appendix 4, "The FIT Programs". This will be used in this chapter and in the next to obtain error estimates.
For the data in Table 5.2.2 the FIT program gives1, for M1 and for M2 respectively, the data fitted to y(x) = a + bx:
    a = 0.7461, siga = 0.0006        a = 0.6844, siga = 0.0010
    b = 0.0727, sigb = 0.1182        b = 0.6330, sigb = 0.1847
chi^2 = 0.1420,    Q = 0.7063        chi^2 = 0.2738,    Q = 0.6008
Thus the ideal values of M1 and M2 respectively are 0.7461(6) and 0.6844(10). Since q > 0.1 we may conclude that "the goodness-of-fit is believable" (see Appendix 4).
From equation (1) in Section 5.1 we now obtain
1/β = 8.030. To estimate the error we take M1 = 0.7461 + 0.0006 and M2 = 0.6844 - 0.0010 to obtain a lower limit for 1/β of 7.825, and M1 = 0.7461 - 0.0006 and M2 = 0.6844 + 0.0010 to obtain an upper limit for 1/β of 8.247, so our final estimate for 1/β is 8.03(21).The exact value of 1/β is 8, derived by Yang (1952). Thus this method produces a result which agrees with the exact value, even if it is not very precise. Precision would probably improve by using larger numbers of samples.
5.3 The Ising Model on the Triangular Lattice
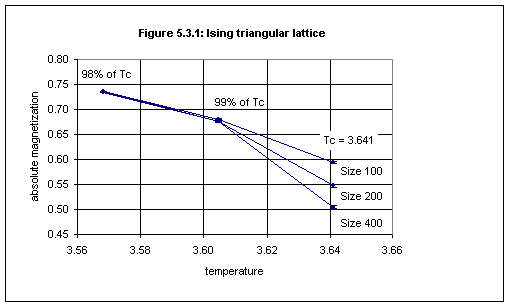
The simulation program was used to extract the value of β for the pure triangular Ising model in the same way, using Wolff dynamics, lattices of size 100, 200 and 400, 1000 or 4000 samples, and obtaining the time average in the same way. Values of the absolute magnetization were obtained for temperatures 3.56818 and 3.60459 (resp. 98% and 99% of the critical temperature of 3.641 — see Section 3.3(b)). The results are shown in Figure 5.3.1 (based on data given in Table 5.3.1 in Appendix 5).
From Table 5.3.1 we obtain Table 5.3.2:
Table 5.3.2
Size
100
200
400
Reciprocal of size
0.0100
0.0050
0.0025
M1
Abs. mag.
0.7351
0.7360
0.7350
Std. dev.
0.0007
0.0007
0.0004
M2
Abs. mag.
0.6804
0.6766
0.6755
Std. dev.
0.0012
0.0014
0.0007
For the data in Table 5.3.2 the FIT program gives, for M1 and for M2 respectively, the data fitted to y(x) = a + bx:
    a = 0.7351, siga = 0.0006        a = 0.6738, siga = 0.0010
    b = 0.0252, sigb = 0.1071        b = 0.6487, sigb = 0.1847
chi^2 = 1.5181,    Q = 0.2179    chi^2 = 0.1217,    Q = 0.7272
Thus we may conclude that the ideal values of M1 and M2 respectively are 0.7351(6) and 0.6738(10).
From equation (1) in Section 5.1 we obtain 1/β = 7.961. We use the same procedure as in Section 5.2 (adding and subtracting errors to M1 and M2 ) to obtain the error for 1/β, namely, (8.176-7.756)/2 = 0.210, so our final estimate for 1/β is 7.96(21). This is close both to the estimate for the square lattice and to the exact value of 8.
5.4 The Ising Model on the Honeycomb Lattice
The simulation program was used to extract the value of β for the pure honeycomb Ising model in the same way as in Sections 5.2 and 5.3, except that measurements were also made with lattice size 800. Values of the absolute magnetization were obtained for temperatures 1.488326 and 1.503513 (resp. 98% and 99% of the critical temperature of 1.5187 — see Section 3.3(c)) but not for the critical temperature. The results are given in Table 5.4.1 in Appendix 5, from which we obtain Table 5.4.2:
Table 5.4.2
Size
100
200
400
800
Reciprocal of size
0.01000
0.00500
0.00250
0.00125
M1
Abs. mag.
0.76258
0.76362
0.76372
0.76373
Std. dev.
0.00062
0.00040
0.00028
0.00020
M2
Abs. mag.
0.69991
0.70209
0.70242
0.70234
Std. dev.
0.00111
0.00079
0.00051
0.00037
For the data in Table 5.4.2 the FIT program gives, for M1 and for M2 respectively, the data fitted to y(x) = a + bx:
M1:
    a = +0.7639, siga = 0.0002
    b = -0.1064, sigb = 0.0668
chi^2 = 0.6709,    Q = 0.7150
M2:
    a = +0.7028, siga = 0.0004
    b = -0.2335, sigb = 0.1222
chi^2 = 0.9495,    Q = 0.6220
Thus we may conclude that the ideal values of M1 and M2 respectively are 0.7639(2) and 0.7028(4).
From equation (1) in Section 5.1 we now obtain
1/β = 8.311. We use the same procedure as in Section 5.2 (adding and subtracting errors to M1 and M2 ) to obtain the error for 1/β, namely, (8.401-8.222)/2 = 0.090, so the final estimate for 1/β is 8.31(9). The exact value is 8, so this measurement gives a result higher than expected. This is probably due to the use of the approximation to M(t) mentioned in Section 5.15.5 The 3-state Potts Model on the Square Lattice
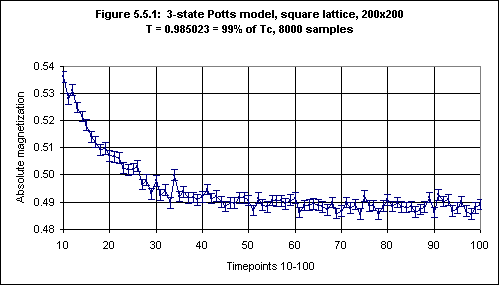
Before proceeding to extract the the value of β for the 3-state Potts model the behaviour of the absolute magnetization using Wolff dynamics was studied. Simulations were performed using the 3-state Potts model on a 200x200 square lattice at 99% of the critical temperature of 0.994973.2 The absolute magnetization was found to stabilize after 40 timesteps, as shown in Figure 5.5.1.3 Accordingly the absolute magnetization was measured by taking a time average over timesteps 50 through 100.
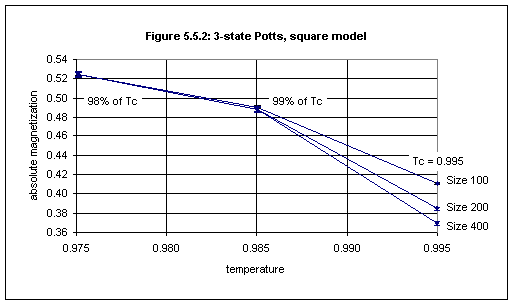
The simulation program was used to extract the value of β for the 3-state Potts model on the square lattice in the same way as for the Ising models in Sections 5.2 - 5.4. Values of the absolute magnetization were obtained for temperatures 0.975073 and 0.985023 (resp. 98% and 99% of the critical temperature of 0.994973). The results are shown in Figure 5.5.2 (based on data given in Table 5.5.2 in Appendix 5).
From Table 5.5.2 we obtain Table 5.5.3:
Table 5.5.3
Size
100
200
400
Reciprocal of size
0.0100
0.0050
0.0025
M1
Abs. mag.
0.5250
0.5247
0.5248
Std. dev.
0.0015
0.0021
0.0017
M2
Abs. mag.
0.4907
0.4887
0.4882
Std. dev.
0.0014
0.0019
0.0027
For the data in Table 5.5.3 the FIT program gives, for M1 and for M2 respectively, the data fitted to y(x) = a + bx:
    a = 0.5247, siga = 0.0021            a = 0.4871, siga = 0.0028
    b = 0.0311, sigb = 0.2954            b = 0.3598, sigb = 0.3463
chi^2 = 0.0047,    Q = 0.9455        chi^2 = 0.0157,    Q = 0.9002
Thus we may conclude that the ideal values of M1 and M2 respectively are 0.5247(21) and 0.4871(28).
From equation (1) in Section 5.1 we now obtain 1/β = 9.322. We use the same procedure as in the previous sections (adding and subtracting errors to M1 and M2) to obtain the error for 1/β, namely, (10.727-8.240)/2 = 1.243, so our final estimate for 1/β is 9.32 ± 1.24. The error is unfortunately large but this result is at least consistent with the conjectured exact value of 9 (based on estimates by series expansion and other methods; details given in Wu 1982, Table VI, p.261).
Title page Contents Next: Chapter 6 References